https://developers.google.com/machine-learning/crash-course/classification/roc-and-auc
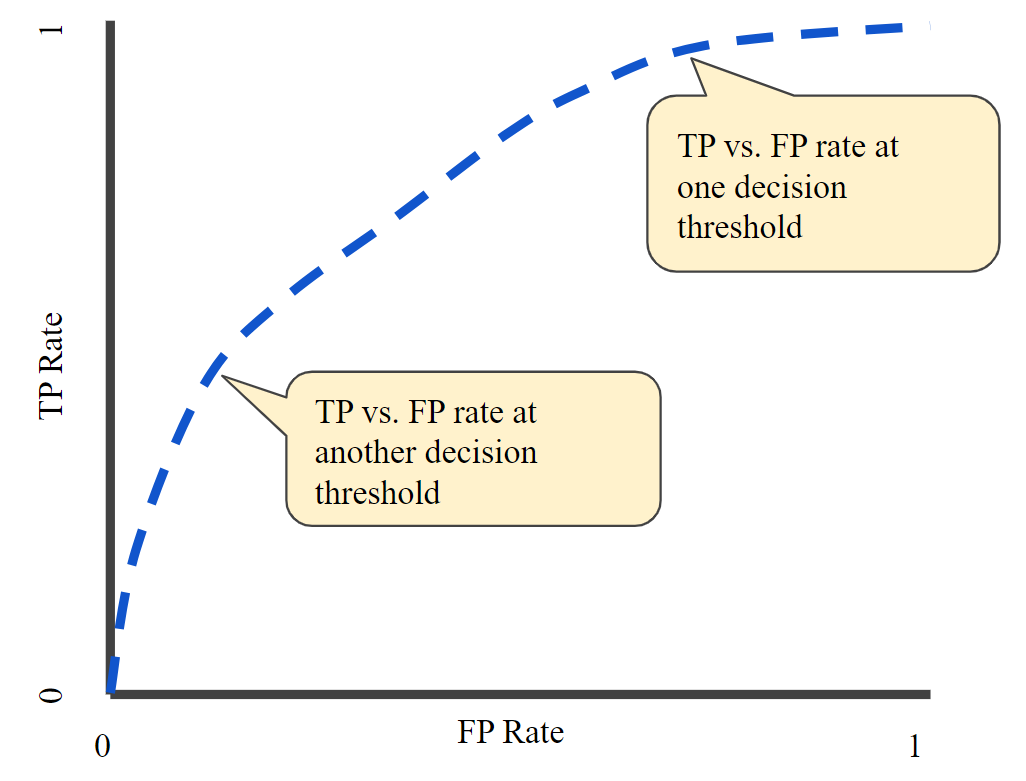
ROC curve
This curve plots two parameters:
True Positive Rate (recall)
False Positive Rate
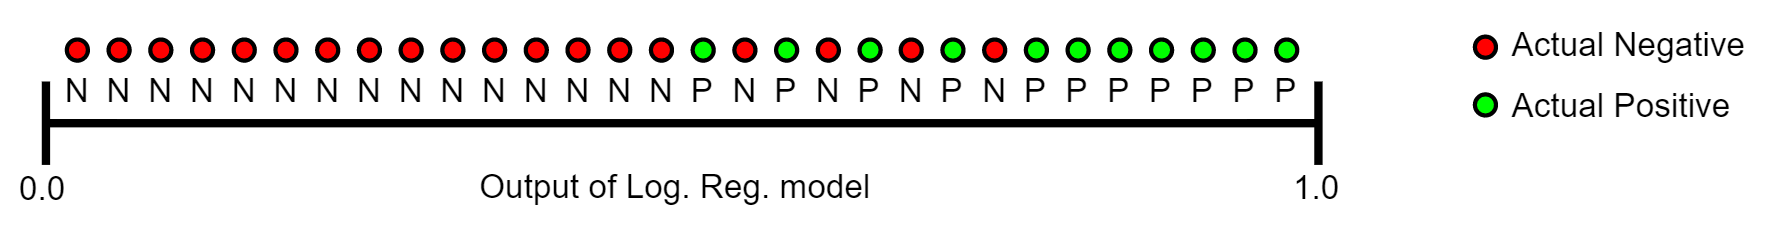
An ROC curve plots TPR vs. FPR at different classification thresholds. 给不同的thresholds,会影响一个样本是分到positive类还是negative类
AUC
AUC measures the entire two-dimensional area underneath the entire ROC curve (think integral calculus) from (0,0) to (1,1).
AUC provides an aggregate measure of performance across all possible classification thresholds
AUC ranges in value from 0 to 1. A model whose predictions are 100% wrong has an AUC of 0.0; one whose predictions are 100% correct has an AUC of 1.0.