内存占用峰值:time -f
$ /usr/bin/time -f "%M KB" <command_and_args>
注意给time传递参数的时候,bash user需要给定time的绝对路径time -f ... ...会报错-f: command not found,这实际上uses an internal version of time, provided as a shell keyword
Users of the bash shell need to use an explicit path in order to run
the external time command and not the shell builtin variant.
time输出程序运行的time memory IO
https://man7.org/linux/man-pages/man1/time.1.html
man time: it output lots of useful
information, not only about time used, but also on other
resources like memory, I/O and IPC calls (where available). The
output is formatted using a format string that can be specified
using the -f option or the TIME environment variable.
Memory
%M Maximum resident set size of the process during its
lifetime, in Kbytes.
%t (Not in tcsh(1).) Average resident set size of the
process, in Kbytes.
%K Average total (data+stack+text) memory use of the process,
in Kbytes.
%F Number of major page faults that occurred while the
process was running. These are faults where the page has
to be read in from disk.time
%e (Not in tcsh(1).) Elapsed real time (in seconds).IO
time命令的输出重定向到文件的方法
time是输出到标准错误的
单一的 > 和 >> 符号默认只会重新定向标准输出。 使用 1 代表标准输入,2 代表标准错误。或者使用&> 同时将标准输入和标准输出重定向
$ rm none-exit-file 2> error.log     # 将错误输出到error.log文件中
$ ls 1> output.log 2> error.log		# 将标准输出流导入文件output.log,将标准错误输出到error.log
$ ls &> output_error.log		    # 将标准输出和标准错误指向同一个文件。
详细堆内存/all内存占用:massif
超级好用!优化程序内存占用的时候再也不用手工检查哪些地方是瓶颈了!
https://valgrind.org/docs/manual/ms-manual.html
is shipped within Valgrind.
By default Massif measures only heap memory, i.e. memory allocated withmalloc, calloc, realloc, memalign, new, new[], and a few other, similar functions. (And it can optionally measure stack memory,--stacks=yes) This means it does not directly measure memory allocated with lower-level system calls such asmmap, mremap, and brk.
if you wish to measure all the memory used by your program, you can use the--pages-as-heap=yes(then Massif’s normal heap block profiling is replaced by lower-level page profiling: Every page allocated viammapand similar system calls is treated as a distinct block)
使用方法
- compile with debugging info (the -g option)
- run Massif itself to gather the profiling information
valgrind --tool=massif prog # The program will execute (slowly)
# output to file massif.out.<pid> # --massif-out-file
- run ms_print to present it in a readable way.
ms_print massif.out.<pid>
ms_print will produce
(a) a graph showing the memory consumption over the program’s execution
- By default, Massif uses “instructions executed” as the unit of time
(b) detailed information about the responsible allocation sites at various points in the program, including the point of peak memory allocation.
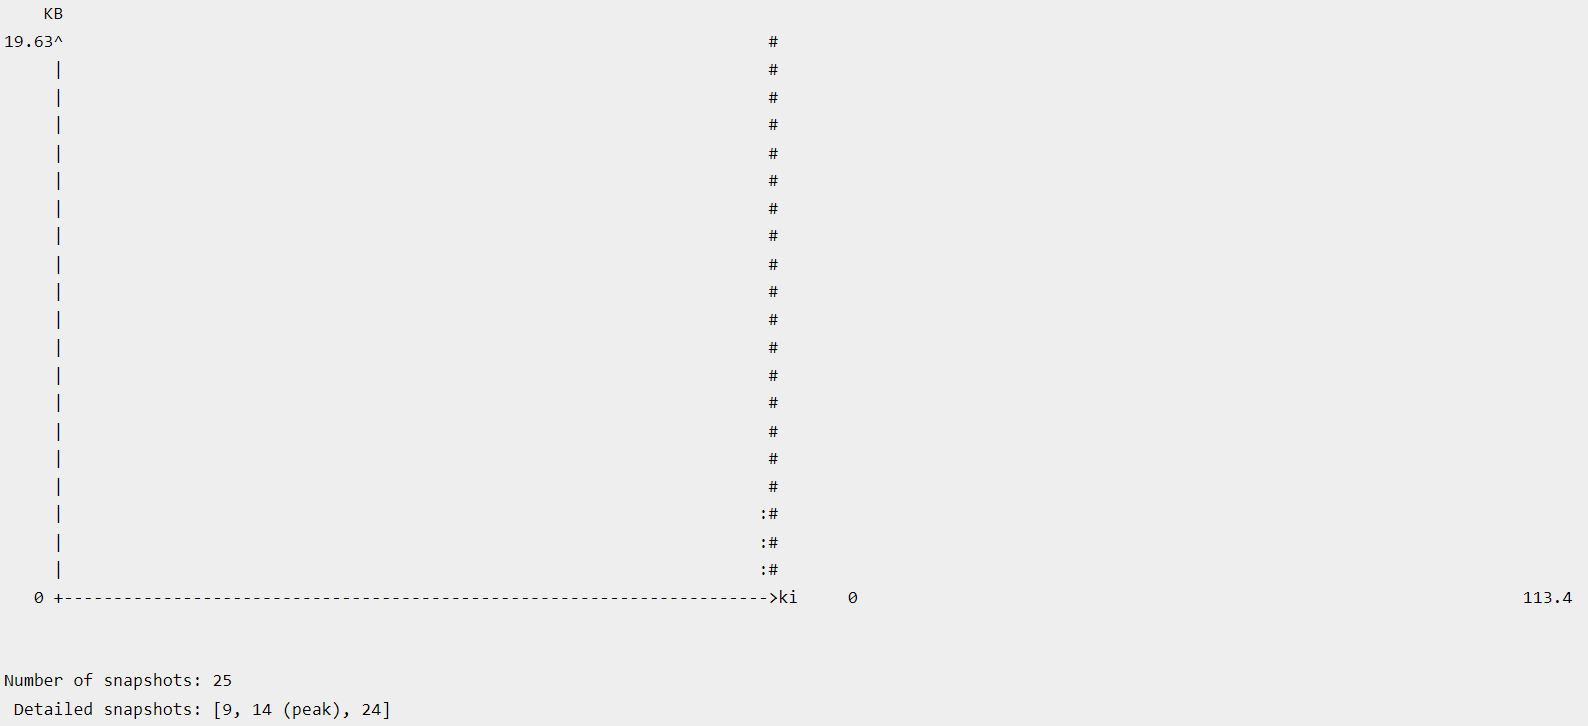
Each vertical bar represents a snapshot, i.e. a measurement of the memory usage at a certain point in time.
ms_print得到(a)图
Note that for very short-run programs, most of the graph empty, with only a couple of bars at the very end: most of the executed instructions involve the loading and dynamic linking of the program. The execution of main (and thus the heap allocations) only occur at the very end. For a short-running program like this, we can use the
--time-unit=Boption to specify that we want the time unit to instead be the number of bytes allocated/deallocated on the heap and stack(s).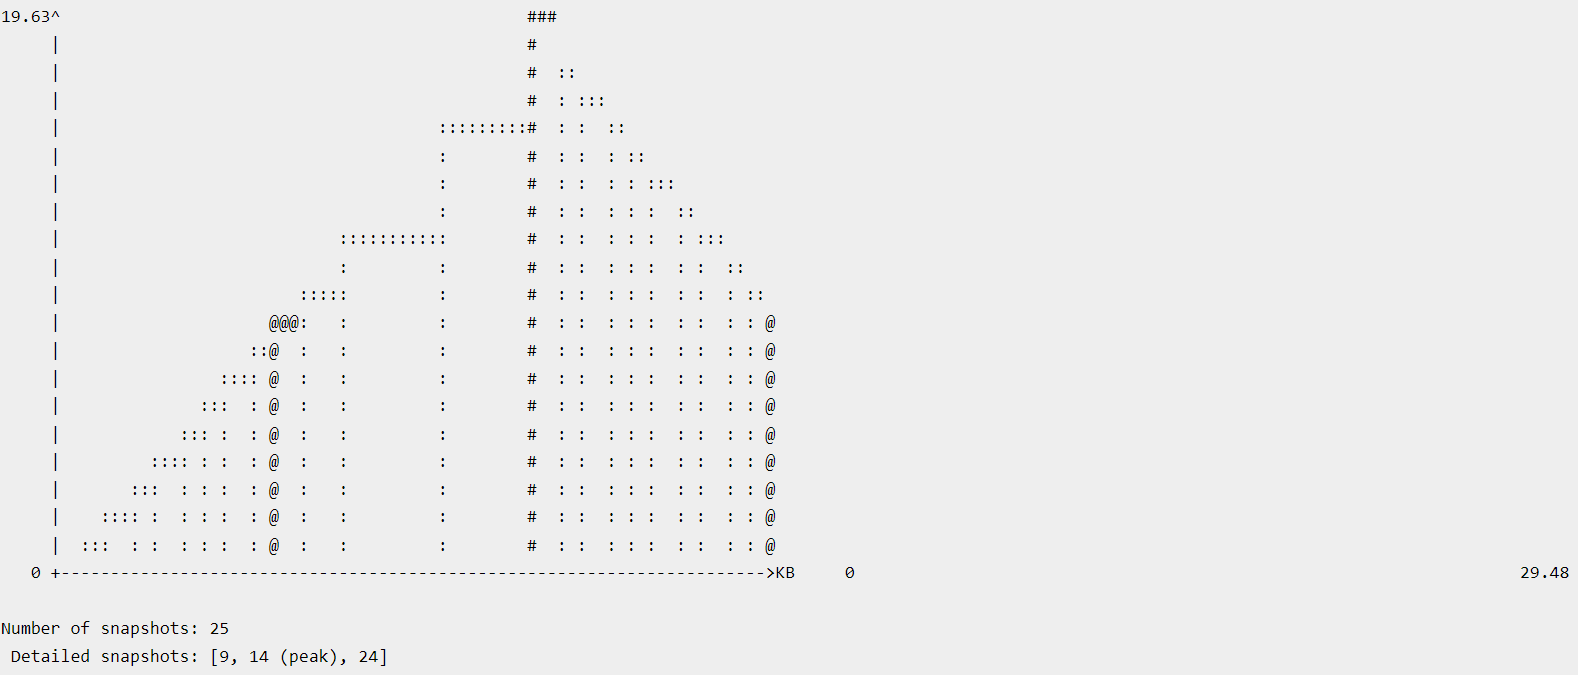
bar字符的含义:
- Most snapshots are normal, and only basic information is recorded for them. Normal snapshots are represented in the graph by bars consisting of ‘:’ characters.
- Some snapshots are detailed. Information about where allocations happened are recorded for these snapshots, as we will see shortly. Detailed snapshots are represented in the graph by bars consisting of ‘@’ characters. The text at the bottom show that 3 detailed snapshots were taken for this program (snapshots 9, 14 and 24). By default, every 10th snapshot is detailed, although this can be changed via the –detailed-freq option.
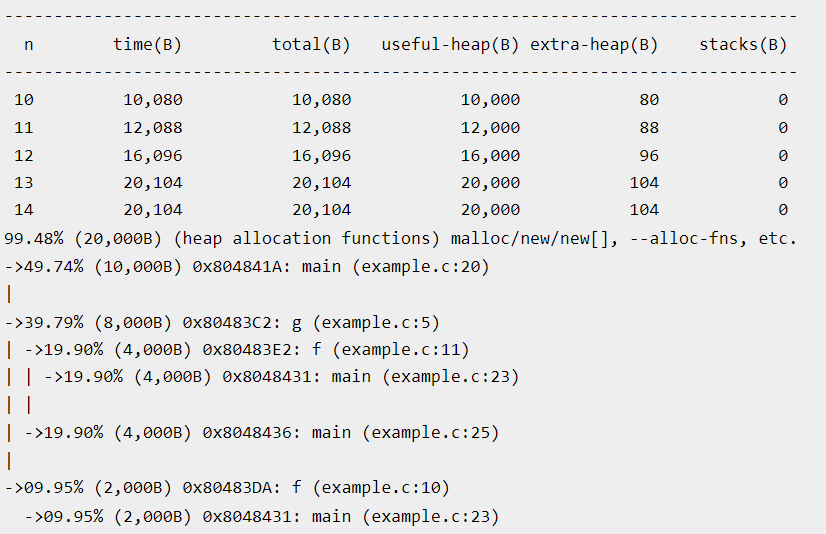
ms_print得到的(b)snapshot info
注意,每个snapshot的内存占比来源分析,都是当前快照下内存的全部实际来源,而不是仅仅看此快照和上一个快照时间之间执行的代码申请的内存噢!所以超级好用!
比如我好奇峰值的时候内存分布,直接去看峰值snapshot的内存来源分析就可以了!
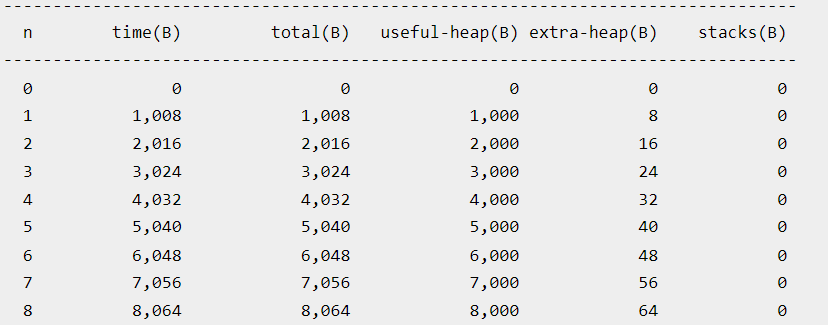
normal snapshot
The next snapshot is detailed. As well as the basic counts, it gives an allocation tree which indicates exactly which pieces of code were responsible for allocating heap memory:
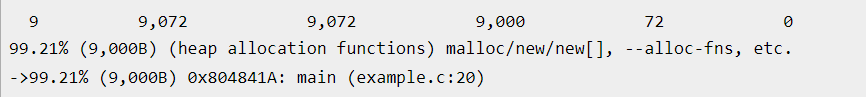
下面最后部分的含义:n=14的snapshots的主要堆内存占用from three different code locations: line 20, which is responsible for 10,000B (49.74%); line 5, which is responsible for 8,000B (39.79%); and line 10, which is responsible for 2,000B (9.95%).