命令
- profile程序(
-t则将把每个线程分开统计并分别输出,-k指定内核调试文件,这样会得到内核的调用信息)
sudo operf -t -k /usr/lib/debug/lib/modules/$(uname -r)/vmlinux ./main
- 根据得到的采集数据输出结果
opreport -o symbols.txt -l
callgraph
若要输出函数callgraph信息(这样每个函数就不仅仅是一行,而是它的调用栈),则都加上–callgraph选项
- profile程序
–callgraph或-g
sudo operf --callgraph -t -k /usr/lib/debug/lib/modules/$(uname -r)/vmlinux ./main
- 根据得到的采集数据输出结果
–callgraph或-c
opreport --callgraph -o symbols.txt -l
输出的含义:https://oprofile.sourceforge.io/doc/opreport.html
输出的每一个entry(一个entry通过----和其他entry分开),含义:
没有缩进的函数是我们关心的函数,
其上的函数是直接调用关心函数的函数(有时会出现不是直接调用关心函数的函数,这是因为这些采样发生在直接调用关心函数的函数刚开始的时候,此时函数栈还没有搭好,误以为是这个函数的caller https://oprofile.sourceforge.io/doc/interpreting-callgraph.html),
其下的函数是关心函数直接调用的函数(其中有一个[self]行,这是关心函数去除调用callee以外的时间)
输出
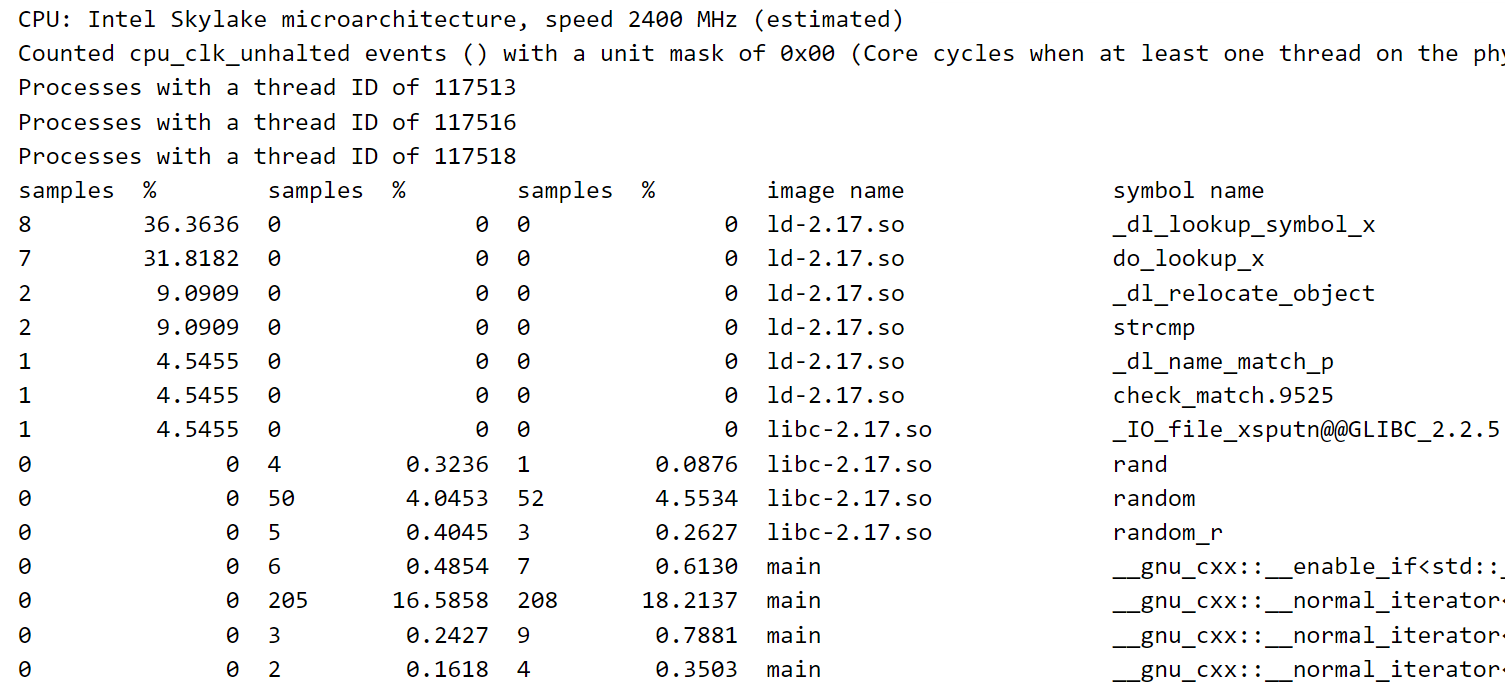
输出的symbols.txt例如:三个线程
每个线程分开统计,下面的%每一列是一个线程(每个%列求和是100),是按第一%列进行降序排序的
附:测试程序
main.cpp
#include <iostream>
#include <thread>
#include <mutex>
#include <algorithm>
#include <vector>
using namespace std;

mutex stdout_mut;

// return first element
int sort_work(int sz)
{
    std::vector<int> arr(sz);
    for (int i = 0; i < sz; ++i)
        arr[i] = rand();
    sort(arr.begin(), arr.end());
    return arr[0];
}

void compute1()
{
    int re = sort_work(100000);
    lock_guard<mutex> lk(stdout_mut);
    cout << pthread_self() << ' ' << re << endl;
}

void compute2()
{
    int re = sort_work(99999);
    lock_guard<mutex> lk(stdout_mut);
    cout << pthread_self() << ' ' << re << endl;
}

int main()
{
    srand(time(0));
    thread th1(compute1);
    th1.join();
    thread th2(compute1);
    th2.join();
    lock_guard<mutex> lk(stdout_mut);
    cout << "main thread: " << pthread_self() << endl;
    return 0;
}
makefile
TARGET=main
main:${TARGET}.cpp makefile
    g++ -std=c++11 -g -Wall -rdynamic -pthread -o main ${TARGET}.cpp
clean:main
    rm -rf main